Service Mesh Architecture: Implementation and Best Practices
Master service mesh architecture with this comprehensive guide covering implementation strategies, security patterns, and operational best practices.
Service Mesh: An Engineering Perspective on Implementation and Best Practices
TL;DR
This guide provides a technical deep-dive into service mesh architectures, focusing on practical implementation details for experienced engineers. It covers core components, common architectural patterns, and detailed guidance on setting up and managing a service mesh. Emphasis is placed on security, traffic control, observability, performance optimization, and deployment strategies, supported by concrete examples and configuration snippets. We conclude with a set of best practices and a decision checklist to aid in evaluating service mesh adoption.
1. Introduction to Service Mesh
A service mesh is an infrastructure layer that abstracts away concerns related to service-to-service communication in cloud-native applications. It provides a dedicated platform for handling essential network functionalities, thereby simplifying application development and enhancing operational control. This document aims to provide experienced engineers with a practical understanding of service mesh concepts, implementation details, and operational best practices, primarily using Istio as a reference implementation where specific examples are provided.
2. Core Service Mesh Architecture Components
A service mesh typically consists of two primary planes and an overarching observability layer.
2.1 Control Plane
The control plane is the central management entity of the service mesh. It configures and manages the data plane proxies to enforce network policies, facilitate service discovery, and manage configurations.
- Service Discovery: Dynamically tracks the location and health of microservices.
- Configuration Management: Distributes routing rules, traffic policies, and security configurations to data plane proxies.
- Certificate Management: Manages TLS certificates for secure mTLS communication between services.
- Policy Enforcement: Enforces access control, rate limiting, and other network policies.
2.2 Data Plane
The data plane is comprised of network proxies, typically deployed as sidecars alongside application services. These proxies intercept all inbound and outbound network traffic for the service.
- Service Proxies (Sidecars): Intercepts network traffic, applies policies, and collects telemetry. Envoy is a common example.
- Load Balancing: Distributes traffic across healthy instances of a service.
- Traffic Routing: Implements sophisticated routing rules (e.g., canary deployments, A/B testing) based on control plane configurations.
- Telemetry Collection: Gathers metrics, logs, and traces for observability.
2.3 Observability Layer
While not strictly part of the service mesh itself, robust observability is a critical outcome and dependency. The service mesh actively contributes to and integrates with this layer.
- Metrics Collection: Aggregates request counts, latency, error rates, etc., from proxies.
- Distributed Tracing: Facilitates tracing requests across multiple services.
- Logging Infrastructure: Centralizes logs generated by proxies and applications.
- Performance Monitoring: Provides insights into service health and communication patterns.
3. Service Mesh Architectural Patterns
The deployment of a service mesh can vary based on operational requirements and network topology.
3.1 Basic Service Mesh Pattern (Single Cluster)
In this common pattern, a single control plane manages the data plane proxies within a single Kubernetes cluster.
- Pros: Simpler setup, centralized management within a single environment.
- Cons: Single point of failure for control plane (if not deployed redundantly), limited cross-cluster functionality.
3.2 Multi-Cluster Service Mesh
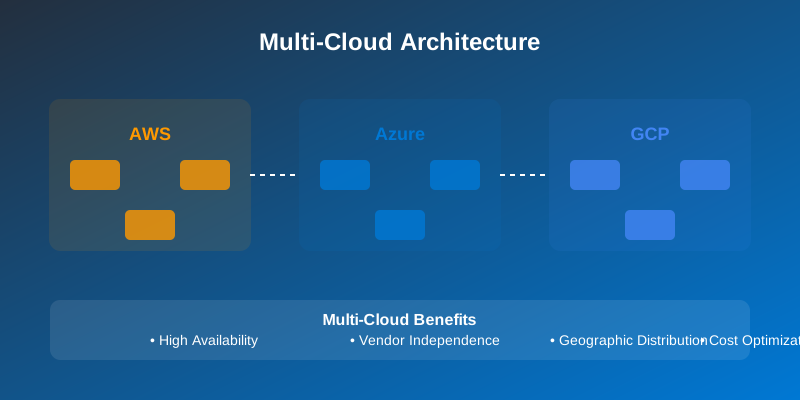
This pattern extends the service mesh across multiple Kubernetes clusters, enabling unified management and seamless inter-cluster communication.
- Pros: Enhanced resilience, geographical distribution, unified policy enforcement across clusters.
- Cons: Increased complexity in setup and network configuration (e.g., CNI, East-West gateway), potential for higher latency between clusters.
4. Implementation Guide: Istio Example
Istio is a popular open-source service mesh widely adopted in cloud-native environments. The following sections detail its installation and configuration.
4.1 Istio Installation and Configuration
Installation typically involves deploying the Istio control plane components to a Kubernetes cluster. This can be done using
istioctl# istio-operator.yaml (Example using Istio Operator) apiVersion: install.istio.io/v1alpha1 kind: IstioOperator metadata: namespace: istio-system # Namespace where Istio control plane components will be installed name: istiod spec: # profile: demo # Use 'default' or a custom profile for production profile: default components: pilot: k8s: resources: requests: cpu: 500m memory: 2048Mi limits: cpu: 1000m memory: 4096Mi ingressGateways: - name: istio-ingressgateway enabled: true k8s: resources: requests: cpu: 100m memory: 128Mi limits: cpu: 200m memory: 512Mi egressGateways: - name: istio-egressgateway enabled: true k8s: resources: requests: cpu: 100m memory: 128Mi limits: cpu: 200m memory: 512Mi values: global: meshID: my-mesh multiCluster: clusterName: cluster1 # Required for multi-cluster setups proxy: resources: requests: cpu: 100m memory: 128Mi limits: cpu: 200m memory: 512Mi
Deployment:
istioctl install -f istio-operator.yaml
Sidecar Injection: To enable Istio's data plane, sidecar proxies must be injected into the application pods. This is commonly achieved via automatic sidecar injection enabled by a label on the namespace.
kubectl label namespace <your-app-namespace> istio-injection=enabled
5. Traffic Management and Routing
The Istio
VirtualServiceDestinationRule5.1 Advanced Traffic Routing
This example demonstrates routing based on request headers (e.g., for A/B testing or phased rollouts) and a default route.
# virtual-service-routing.yaml
apiVersion: networking.istio.io/v1beta1 # Use v1beta1 for Istio 1.10+
kind: VirtualService
metadata:
  name: my-app-service
  namespace: default
spec:
  hosts:
    - my-app-service.default.svc.cluster.local # Fully qualified domain name
  http:
    - match:
        - headers:
            user-agent:
              regex: ".*mobile.*" # Route mobile users to v2
      route:
        - destination:
            host: my-app-service
            subset: v2
          weight: 100 # All mobile traffic goes to v2
    - match:
        - headers:
            end-user:
              exact: "customer-id-123" # Route specific customer to v1
      route:
        - destination:
            host: my-app-service
            subset: v1
          weight: 100
    - route: # Default route for all other traffic
        - destination:
            host: my-app-service
            subset: v1 # Default to v1
          weight: 100
5.2 Traffic Splitting (Canary Deployment)
VirtualService# virtual-service-canary.yaml apiVersion: networking.istio.io/v1beta1 kind: VirtualService metadata: name: my-app-service namespace: default spec: hosts: - my-app-service.default.svc.cluster.local http: - route: - destination: host: my-app-service subset: v1 weight: 90 # 90% of traffic to v1 - destination: host: my-app-service subset: v2 # 10% of traffic to v2 (the canary) weight: 10
A
DestinationRuleVirtualService# destination-rule-subsets.yaml apiVersion: networking.istio.io/v1beta1 kind: DestinationRule metadata: name: my-app-service namespace: default spec: host: my-app-service.default.svc.cluster.local subsets: - name: v1 labels: version: v1 # Kubernetes deployment label - name: v2 labels: version: v2 # Kubernetes deployment label
6. Security Implementation
Service meshes significantly enhance security posture through managed mTLS and fine-grained authorization policies.
6.1 Mutual TLS (mTLS) Enforcement
Ensuring secure communication between services using mTLS.
- Policy: Controls the mTLS mode for a workload or namespace.
PeerAuthentication- : Only allow authenticated clients using mTLS.
STRICT - : Allow both mTLS and plaintext traffic (useful during migration).
PERMISSIVE - : Do not enforce mTLS.
DISABLE
# peer-authentication-strict.yaml
apiVersion: security.istio.io/v1beta1
kind: PeerAuthentication
metadata:
  name: default # Applies to all services in the namespace
  namespace: default # Or specify a namespace like 'istio-system'
spec:
  mtls:
    mode: STRICT # Enforces mTLS for all incoming traffic to services in this namespace
6.2 Authorization Policy
Defines access control rules for workloads.
# authorization-policy-allow-get-info.yaml
apiVersion: security.istio.io/v1beta1
kind: AuthorizationPolicy
metadata:
  name: allow-get-info-for-httpbin
  namespace: default
spec:
  selector:
    matchLabels:
      app: httpbin # Apply policy to services with this label
  action: ALLOW # Explicitly allow operations that match the rules
  rules:
    - from:
        - source:
            principals: ["cluster.local/ns/default/sa/sleep"] # Allow traffic from the 'sleep' service account
      to:
        - operation:
            methods: ["GET"] # Only allow GET requests
            paths: ["/info*"] # To paths starting with /info
7. Traffic Control Patterns
Beyond basic routing, service meshes offer advanced control for resilience and fault tolerance.
7.1 Circuit Breaking
Prevents cascading failures by detecting and preventing calls to unhealthy service instances.
# destination-rule-circuitbreaker.yaml
apiVersion: networking.istio.io/v1beta1
kind: DestinationRule
metadata:
  name: my-app-service
  namespace: default
spec:
  host: my-app-service.default.svc.cluster.local
  trafficPolicy:
    outlierDetection:
      consecutive5xxErrors: 5 # Eject host after 5 consecutive 5xx errors
      interval: 10s           # Check for errors every 10 seconds
      baseEjectionTime: 60s   # Eject host for 60 seconds
      maxEjectionPercent: 50  # Do not eject more than 50% of hosts
7.2 Retry Policy
Automatically retries failed requests according to configured parameters.
# virtual-service-retry.yaml
apiVersion: networking.istio.io/v1beta1
kind: VirtualService
metadata:
  name: my-app-service
  namespace: default
spec:
  hosts:
    - my-app-service.default.svc.cluster.local
  http:
    - route:
        - destination:
            host: my-app-service
            subset: v1
      retries:
        attempts: 3 # Retry up to 3 times
        perTryTimeout: 5s # Timeout for each individual retry attempt
        retryOn: # Conditions to trigger a retry
          - connect-failure
          - refused-stream
          - "5xx" # Retry on HTTP 5xx errors
          - "gateway-error" # Retry on HTTP gateway errors
8. Observability Implementation
Leveraging the service mesh for comprehensive monitoring and insights.
8.1 Metrics Collection Integration
Istio proxies (Envoy) emit metrics in Prometheus format by default. The Istio control plane components can be configured to scrape these.
# prometheus-scrape-config (Example snippet for Prometheus Operator's ServiceMonitor)
apiVersion: monitoring.coreos.com/v1
kind: ServiceMonitor
metadata:
  name: istio-mesh
  namespace: istio-system
  labels:
    release: prometheus # Your Prometheus Operator release label
spec:
  selector:
    matchLabels:
      app: istiod # Select Istio control plane pods
      istio: istiod
  namespaceSelector:
    matchNames:
      - istio-system # Namespace where Istio control plane is installed
  endpoints:
    - port: http-monitoring # Port where metrics are exposed by Istiod
      interval: 30s
      path: /metrics
8.2 Distributed Tracing Configuration
Istio integrates with tracing backends like Jaeger, Zipkin, or OpenTelemetry.
# istio-operator.yaml (Snippet for enabling tracing)
# ...
spec:
  components:
    # ... other components
    tracing:
      enabled: true
      providers:
        - name: "jaeger"
          jaeger:
            address: "jaeger-collector.istio-system.svc.cluster.local:9411" # Jaeger agent/collector address
            sampling: 100.0 # Percentage of traces to sample
Envoy Filter for Tracing (Example): While Istio configures tracing by default,
EnvoyFilter# envoy-filter-tracing-custom.yaml apiVersion: networking.istio.io/v1beta1 kind: EnvoyFilter metadata: name: custom-tracing namespace: istio-system spec: configPatches: - applyTo: HTTP_FILTER match: context: SIDECAR_OUTBOUND # Apply to outbound traffic from sidecars patch: operation: INSERT_BEFORE value: name: envoy.filters.http.router typed_config: "@type": type.googleapis.com/envoy.extensions.filters.http.router.v3.Router # Example: custom tracer configuration # tracer_config: # ...
9. Performance Optimization
Tuning the service mesh can yield significant performance gains and efficient resource utilization.
9.1 Resource Management for Proxies
Properly sizing the resource requests and limits for sidecar proxies is crucial to avoid impacting application performance or mesh stability.
# istio-operator.yaml (Snippet for proxy resource configuration)
# ...
spec:
  values:
    global:
      proxy:
        resources:
          requests:
            cpu: 100m
            memory: 128Mi
          limits:
            cpu: 200m
            memory: 512Mi
9.2 Connection Pooling and Timeout Tuning
Configuring connection pools and timeouts to optimize resource usage and responsiveness.
# destination-rule-connectionpool.yaml
apiVersion: networking.istio.io/v1beta1
kind: DestinationRule
metadata:
  name: my-app-service
  namespace: default
spec:
  host: my-app-service.default.svc.cluster.local
  trafficPolicy:
    connectionPool:
      tcp:
        maxConnections: 1000 # Max concurrent TCP connections to a service host
        connectTimeout: 10ms # Timeout for establishing TCP connection
      http:
        http1MaxPendingRequests: 100 # Max pending HTTP/1.1 requests
        http2MaxRequests: 1000     # Max pending HTTP/2 requests per connection
        maxRequestsPerConnection: 100 # Max requests per HTTP/1.1 connection
        idleTimeout: 120s          # Idle timeout for HTTP/1.1 connections
        h2KeepaliveTimeout: 30s    # HTTP/2 keep-alive timeout
    tls:
      mode: ISTIO # Uses mTLS
      sni: my-app-service.default.svc.cluster.local
    loadBalancer:
      simple: ROUND_ROBIN # Or other LB algorithms like LEAST_REQUEST
10. Deployment Strategies Leveraging Service Mesh
Service meshes greatly simplify and enable advanced deployment strategies like canary and blue-green deployments.
10.1 Canary Deployment with Traffic Shifting
Achieved by defining weighted routes in a
VirtualService# virtual-service-canary-deployment.yaml apiVersion: networking.istio.io/v1beta1 kind: VirtualService metadata: name: my-app-service namespace: default spec: hosts: - my-app-service.default.svc.cluster.local http: - route: - destination: host: my-app-service subset: v1 # Current stable version weight: 95 - destination: host: my-app-service subset: v2 # New version for canary testing weight: 5
10.2 Blue-Green Deployment with Traffic Shifting
This can be implemented by routing traffic based on specific headers or cookies to distinct versions (e.g.,
my-app-service-bluemy-app-service-green# virtual-service-blue-green.yaml apiVersion: networking.istio.io/v1beta1 kind: VirtualService metadata: name: my-app-service namespace: default spec: hosts: - my-app-service.default.svc.cluster.local http: - match: # Route all traffic with specific header to green - headers: x-deployment-target: exact: "green" route: - destination: host: my-app-service-green # Assume a separate deployment for green - route: # Default route to blue - destination: host: my-app-service-blue # Assume the current stable deployment
11. Monitoring and Management
The service mesh provides critical data for operational monitoring and management.
11.1 Health Checks and Endpoint Ejection
While Kubernetes handles basic pod health, service meshes enhance this by actively monitoring successful request rates and removing unhealthy endpoints from service rotation.
# destination-rule-healthcheck.yaml
apiVersion: networking.istio.io/v1beta1
kind: DestinationRule
metadata:
  name: my-app-service
  namespace: default
spec:
  host: my-app-service.default.svc.cluster.local
  trafficPolicy:
    outlierDetection:
      consecutiveErrors: 3     # Eject after 3 consecutive errors
      interval: 5s             # Check interval
      baseEjectionTime: 30s    # Ejection duration
      unhealthyEdgePorts: true # Eject if container ports are unhealthy
11.2 Performance Monitoring via Telemetry
The
ServiceMeshMonitor// This is a conceptual example of how to process metrics. // Actual implementation would involve integrating with Prometheus/Grafana APIs // or consuming metrics directly from proxy endpoints if feasible. class ServiceMeshMetricsProcessor { // In a real-world scenario, this would query a time-series database // like Prometheus or an observability platform. // For demonstration, we simulate fetching data. async fetchServiceMetrics(serviceName: string): Promise<object> { console.log(`Simulating fetch for metrics of ${serviceName}...`); // Simulate fetching data that includes requestCount, latency, and errorRate // The service mesh proxies expose these metrics (e.g., envoy_http_request_total, // envoy_cluster_upstream_rq_time). const simulatedData = { serviceName: serviceName, requestCount: Math.floor(Math.random() * 10000) + 1000, averageLatencyMs: Math.floor(Math.random() * 500) + 50, // Simulate latency in ms errorRatePercent: Math.floor(Math.random() * 10) + 0.1 // Simulate error rate }; return simulatedData; } async analyzeServicePerformance(serviceName: string): Promise<void> { try { const metrics = await this.fetchServiceMetrics(serviceName); console.log(`--- Performance Analysis for ${serviceName} ---`); console.log(`Total Requests: ${metrics.requestCount}`); console.log(`Average Latency: ${metrics.averageLatencyMs}ms`); console.log(`Error Rate: ${metrics.errorRatePercent.toFixed(2)}%`); if (metrics.averageLatencyMs > 200) { console.warn(`WARNING: High latency detected for ${serviceName}. Threshold is 200ms.`); } if (metrics.errorRatePercent > 5.0) { console.error(`CRITICAL: High error rate detected for ${serviceName}. Threshold is 5.0%.`); } console.log("--------------------------------------"); } catch (error) { console.error(`Error analyzing performance for ${serviceName}:`, error); } } } // Example Usage: // const monitor = new ServiceMeshMetricsProcessor(); // monitor.analyzeServicePerformance("my-app-service");
12. Honest Trade-offs
Adopting a service mesh introduces complexity and resource overhead.
- Increased Latency: Each request traverses at least two proxies (client-sidecar and server-sidecar), adding a small but measurable latency overhead.
- Resource Consumption: Sidecar proxies consume CPU and memory resources that would otherwise be available to application containers.
- Operational Complexity: Managing the control plane, its configuration, and understanding its interactions adds significant operational burden, requiring specialized knowledge.
- Configuration Drift: Ensuring consistent configuration across a large mesh can be challenging.
- Debugging Overhead: Debugging network issues can become more complex as you need to consider the proxies' behavior.
13. When Not to Use a Service Mesh
A service mesh is not a silver bullet and may be overkill for certain scenarios.
- Simple Monolithic Applications: If your application is a single monolith with no need for complex inter-service communication patterns, a service mesh is likely unnecessary.
- Few Microservices: For applications with only a handful of microservices and straightforward communication, native Kubernetes networking features (e.g., Services, Ingress) might suffice.
- Limited Operational Capacity: If your team lacks the expertise or resources to manage an additional complex infrastructure layer, consider delaying adoption or starting with simpler solutions.
- Strict Latency Requirements: If your application has extremely stringent latency requirements where even a few milliseconds of overhead are unacceptable, a service mesh might not be suitable.
- Mature, Custom-Built Solutions: If you already have a well-established and effective solution for service discovery, load balancing, and security within your existing architecture, a service mesh might not offer sufficient incremental value.
14. Decision Checklist
Use this checklist to evaluate if a service mesh is the right choice for your project.
| Feature/Requirement | Current State | Needs Service Mesh? | Notes | | :-------------------------------------- | :------------ | :------------------ | :------------------------------------------------------------------------------------------------- | | Service Discovery Complexity | Low / Medium / High | Yes / No | How dynamic is your service topology? | | Advanced Traffic Management Needs | None / Basic / Advanced | Yes / No | Canary deployments, A/B testing, traffic mirroring, etc. | | Security Requirements (mTLS) | None / Basic / Strict | Yes / No | Is end-to-end encryption and identity verification critical? |